At NOWPayments, we continuously strive to improve our platform’s efficiency and user experience. One of our latest updates focuses on enhancing the statistics section in the dashboard, ensuring smoother data access and better performance for our partners.
What’s New?
Previously, some of our major partners experienced loading issues with dashboard graphs due to the legacy data calculation method. To address this, we have transitioned to a new aggregated data collection method that significantly improves performance and reliability.
Key Benefits of the Update
✅ Faster and more stable statistics display – The new method ensures that all users, regardless of transaction volume, can access their data without delays.
✅ Fixed time zone display – All statistics are now shown in UTC time, ensuring consistency across different regions.
✅ Improved visualization – The updated graphs and reports provide clearer insights into balance, payouts, turnover, and transaction trends.
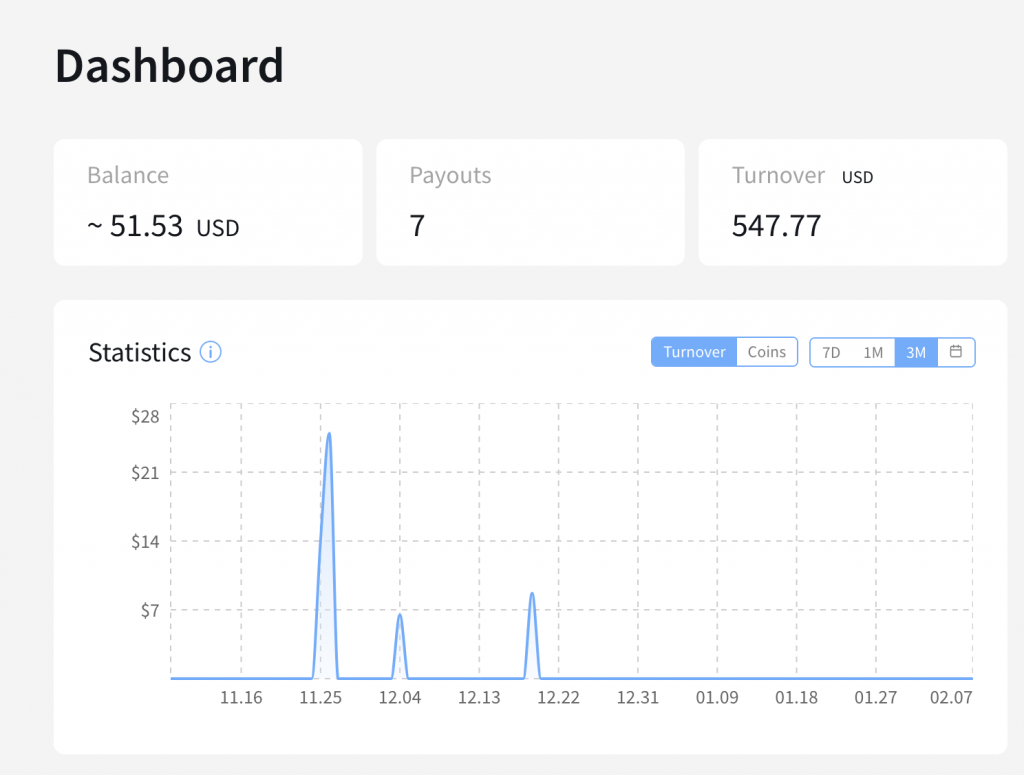
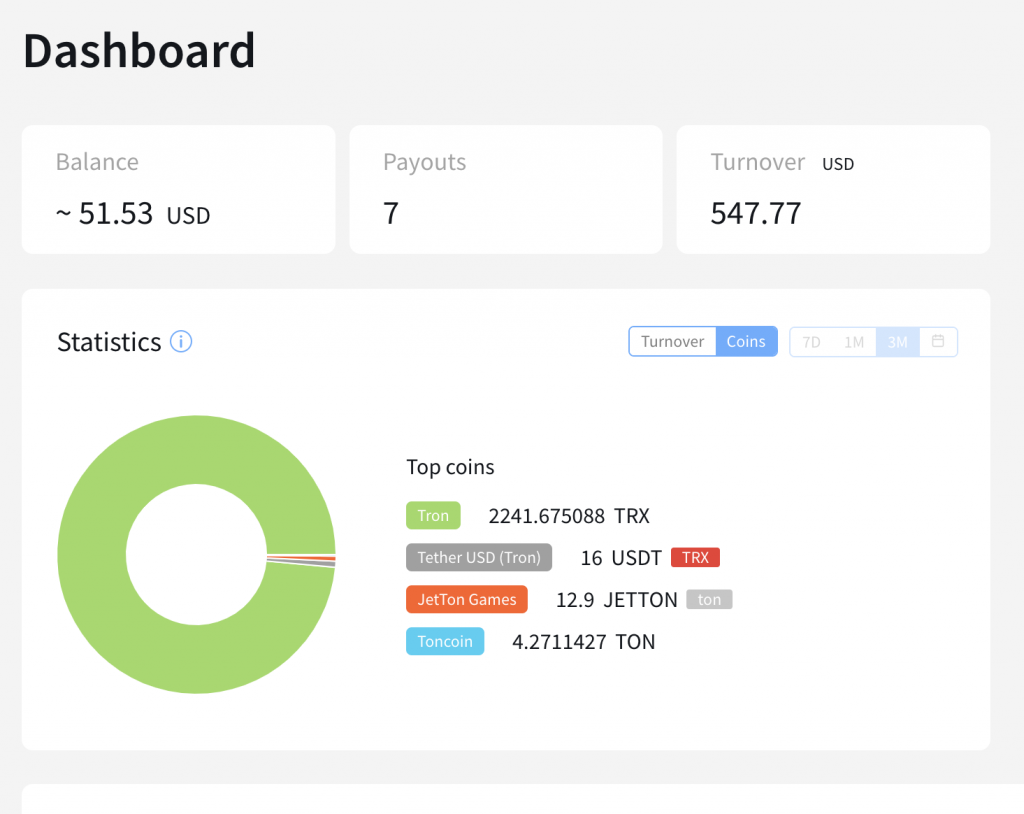
How It Looks Now
With this update, the dashboard now provides seamless access to transaction insights. Users can easily track their top coins, monitor turnover over different periods (7 days, 1 month, 3 months), and gain a comprehensive view of their payment performance.
We believe this optimization will greatly enhance usability and transparency for all NOWPayments users. As always, we appreciate your feedback and are committed to continuous improvements.
Try out the new statistics section by logging into your NOWPayments Dashboard.